Trucking Innovation Tracking panel
Trucking Innovation develops site control software for construction companies: hauling, equipment, fuel and warehouses. We built them a panel that shows at a glance which customer is working and which one has stopped, and the reports their customers use to control their hauling.
- INDUSTRY
- Construction site control software
- WHAT WE DID
- Tracking panel and reports for its customers
- WHEN
- 2026
- FOR WHOM
- Trucking's management and its customers
Where they started
To know whether a customer was still working, someone had to check an Excel file filled in by hand. The reports had the data, but they were slow for a question that should take seconds.
And some reports were incomplete: one construction company's report only showed 4 of its 20 sites.
How we approached it
- We reviewedWhere each piece of data comes from: what the machines record and the trucks' trips.
- We mappedThe whole portfolio, from each group down to each site, and when a site counts as stopped: up to 3 days without activity is normal; more than 7, someone should check.
- We recommendedA simple panel, separate from the reports, running alongside the Excel file until it proved it gave the same numbers.
- We builtThe tracking panel, the reports fixed for every site, and a phone version.
What we built
Tracking panel
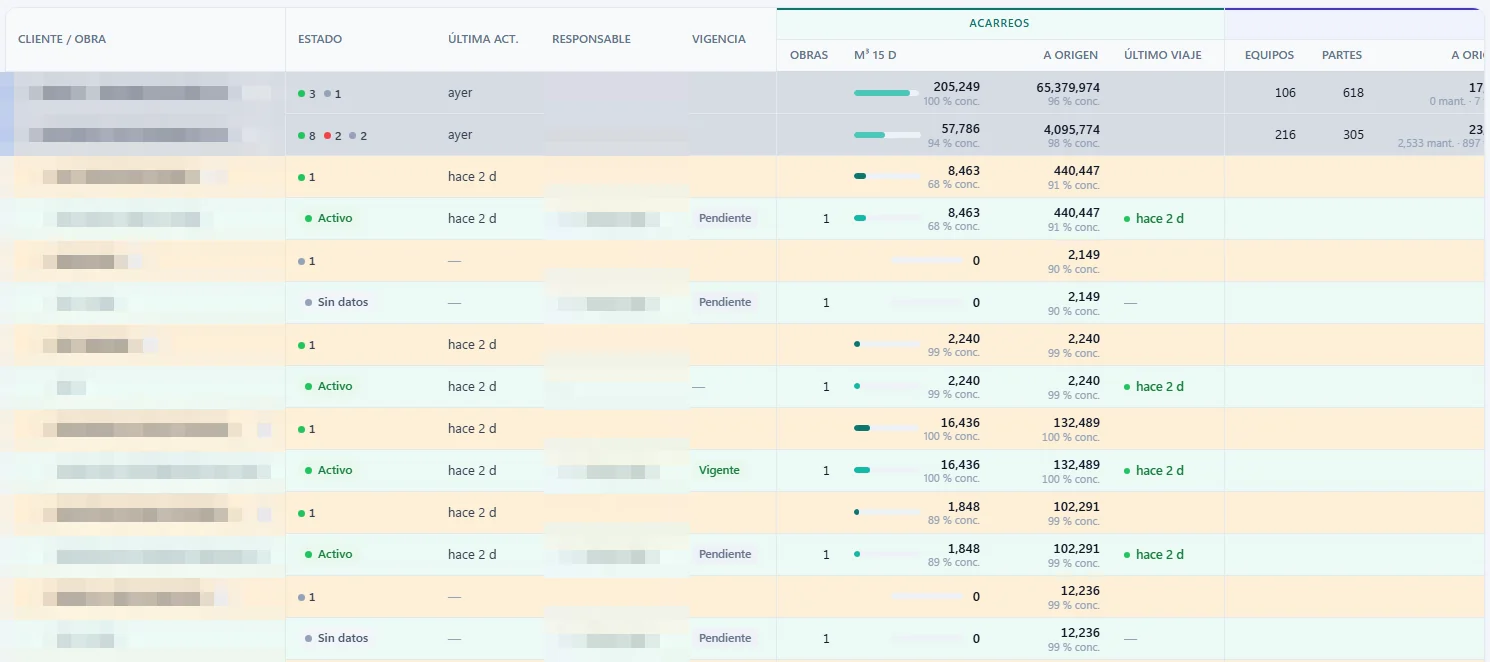
One screen tells you which customer is working. It brings hauling and equipment together by group, customer and site, and updates itself every three hours.
- Traffic light per site · working, on alert, stopped or no data
- The whole portfolio · customers, contracts, sites and equipment
- Alerts to whoever is in charge of each site
- Site detail with the last month at a glance
- Access per person and a record of changes
- On the phone, each site as a card
Power BI reports for Trucking's customers
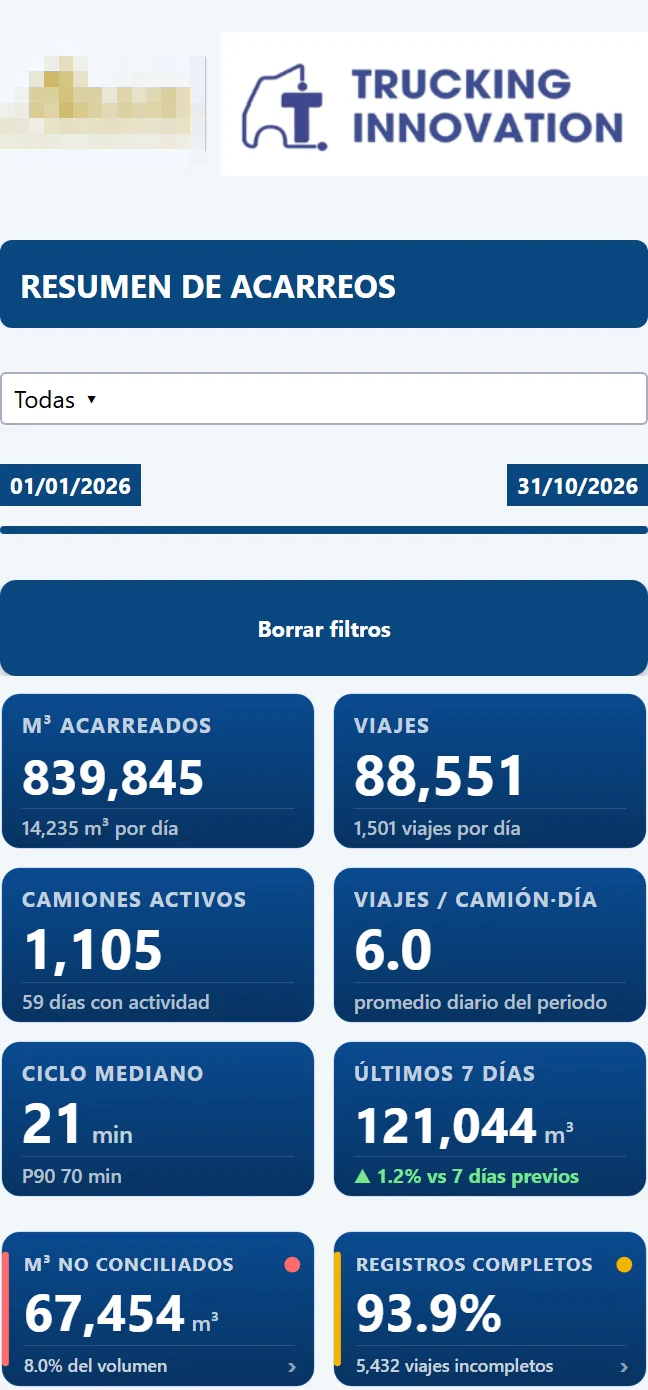
A family of Power BI reports so each construction company can control its site: material hauling, equipment and a phone version for management. They see how many trips and cubic meters were moved, who moved them, on which route, and whether what left matches what arrived.
- Summary by origin, destination and day
- Carriers, trucks and routes
- Materials and cubic meters
- What left vs. what arrived, trip by trip
- Daily report with trip details
- Phone version for management, flagging what doesn't match
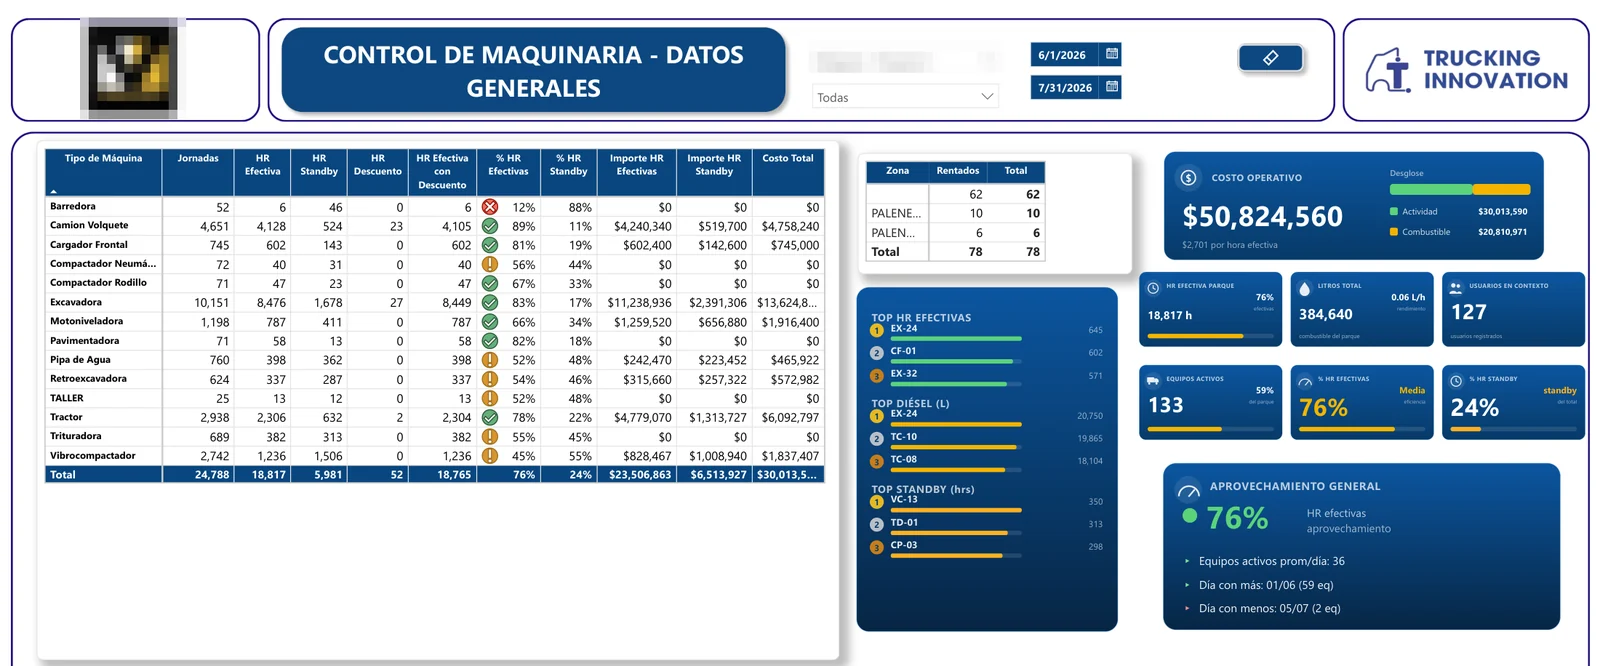
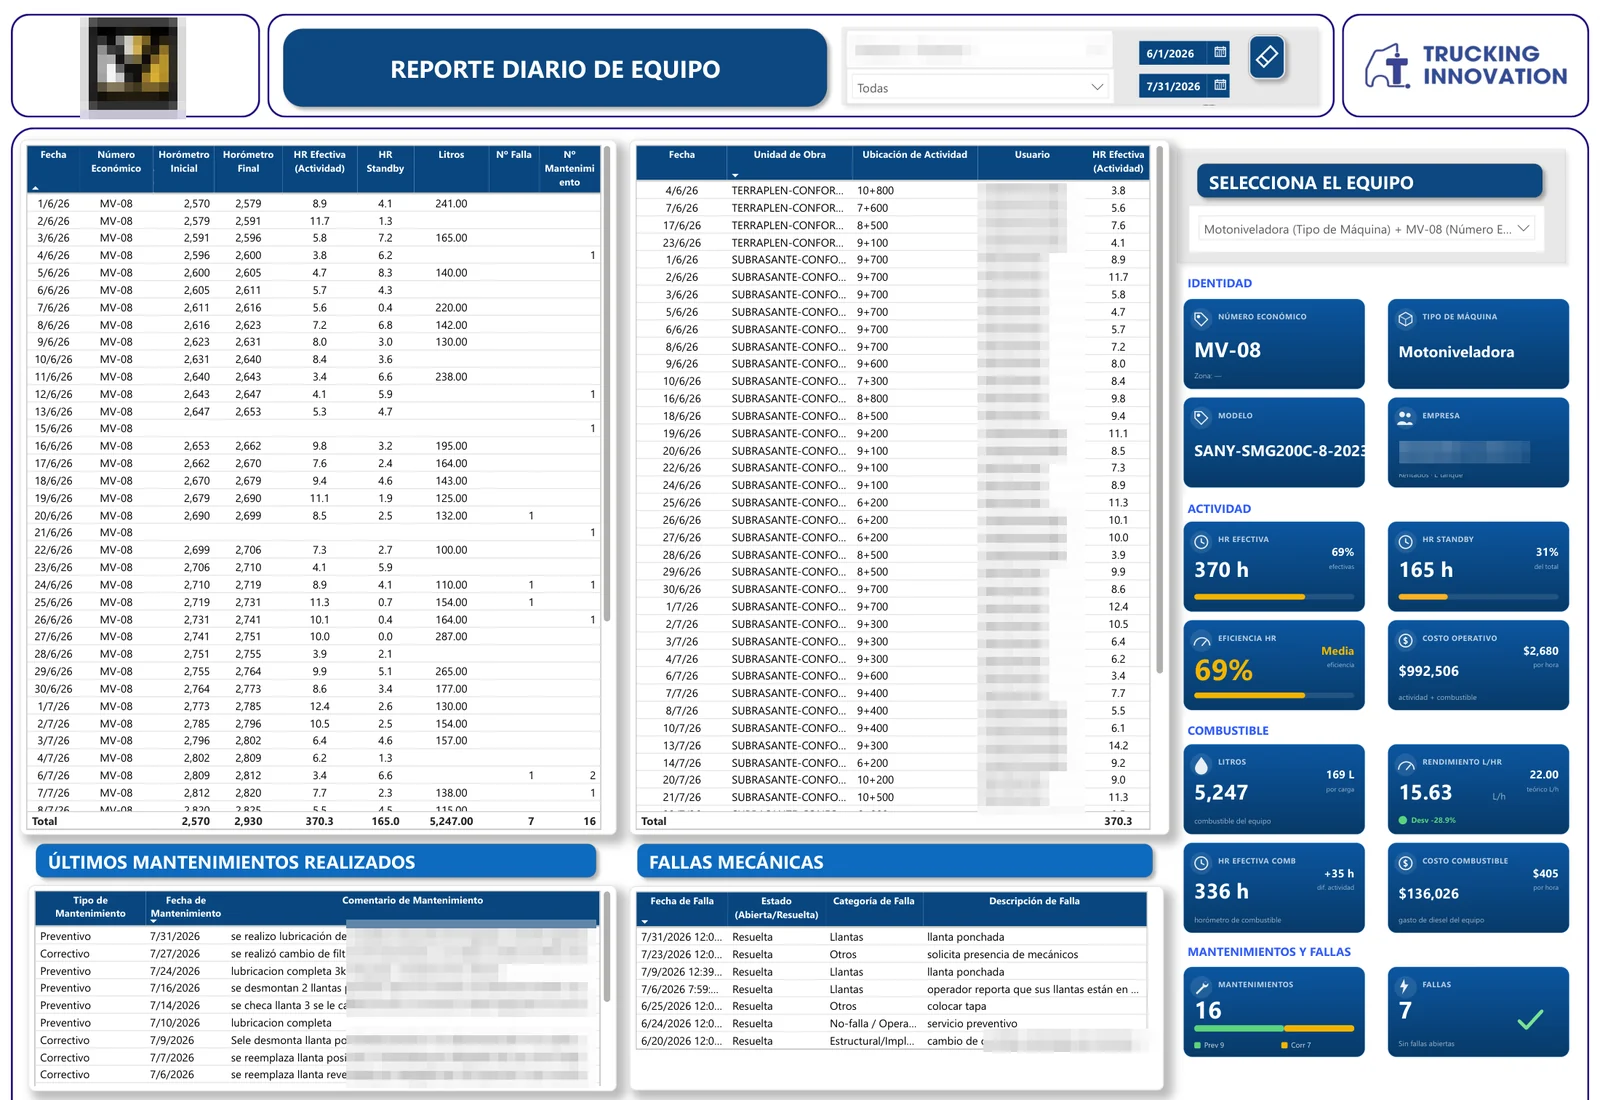
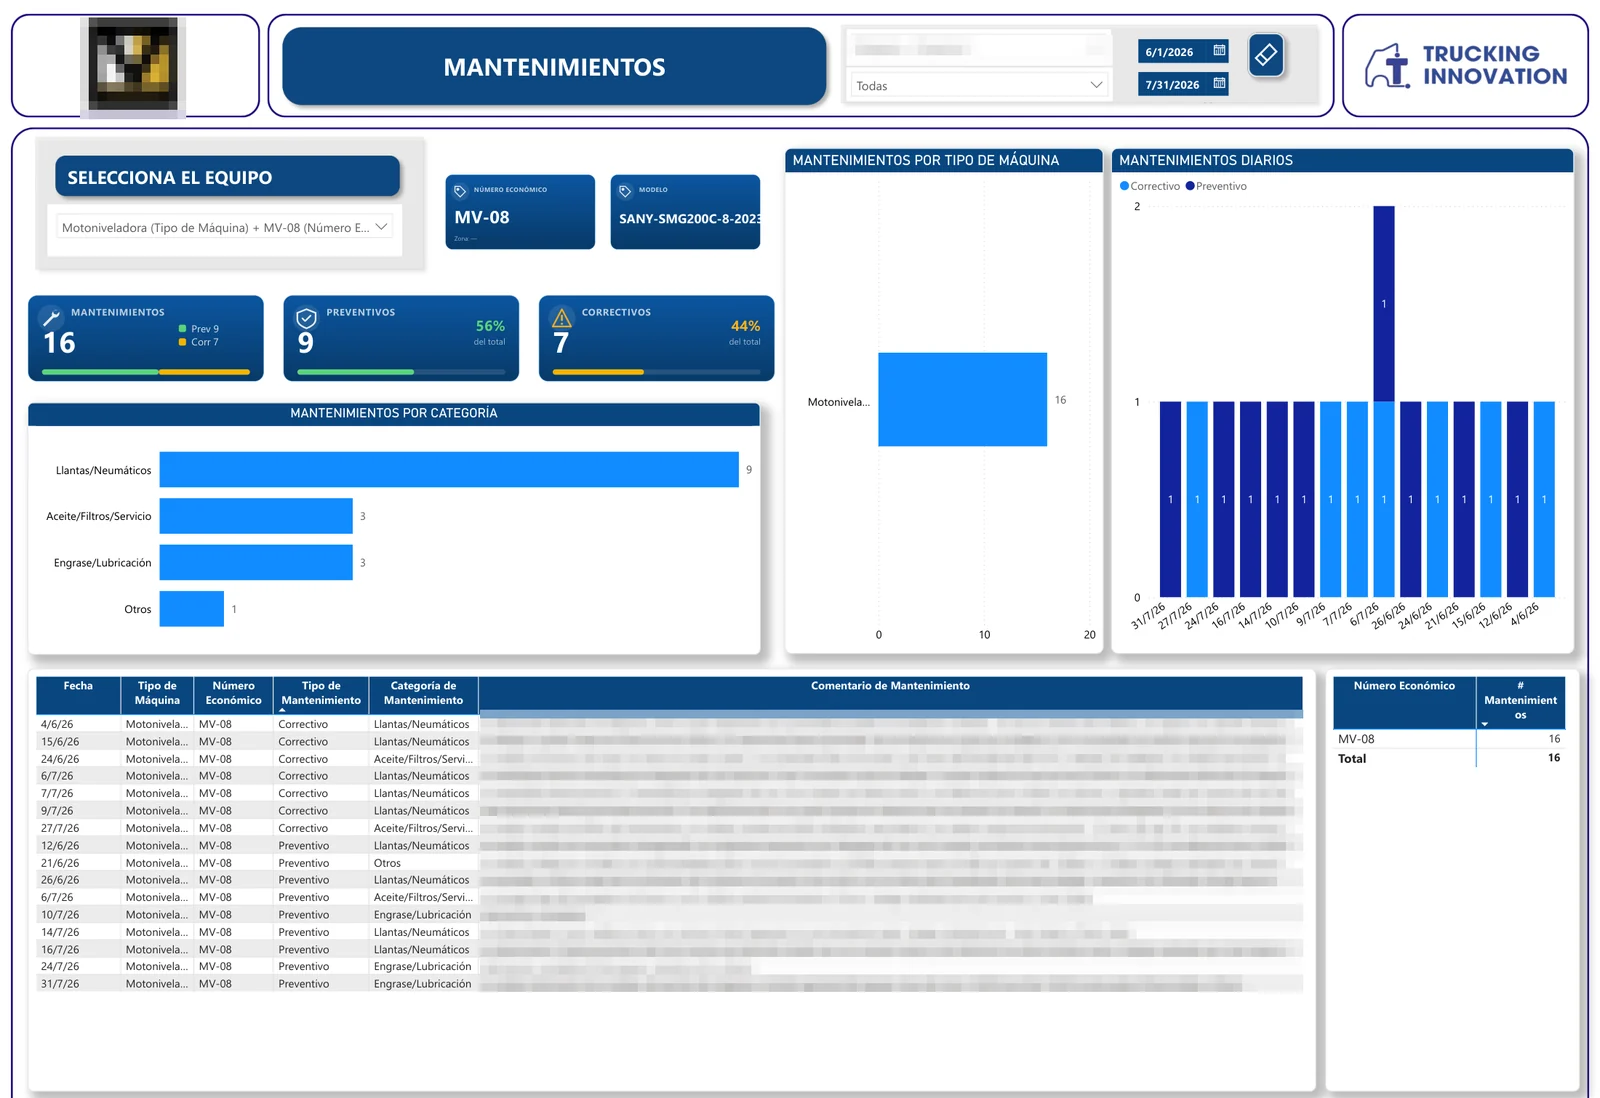
For equipment, each contractor sees the hours worked and idle, diesel, cost and maintenance of every machine: from the whole fleet down to a single day.
By the numbers
- 60hauling sites visible in the panel
- 70customers and 68 contracts in one place
- 13reports across 11 projects, including the phone version
- 3 hhow often the panel updates itself, with no one touching it
- 4 → 20sites a construction company sees in its report after we fixed it
Figures taken from the project documentation, October 2026.
Got a similar process?
Tell us how you track it today and we'll tell you where to start.